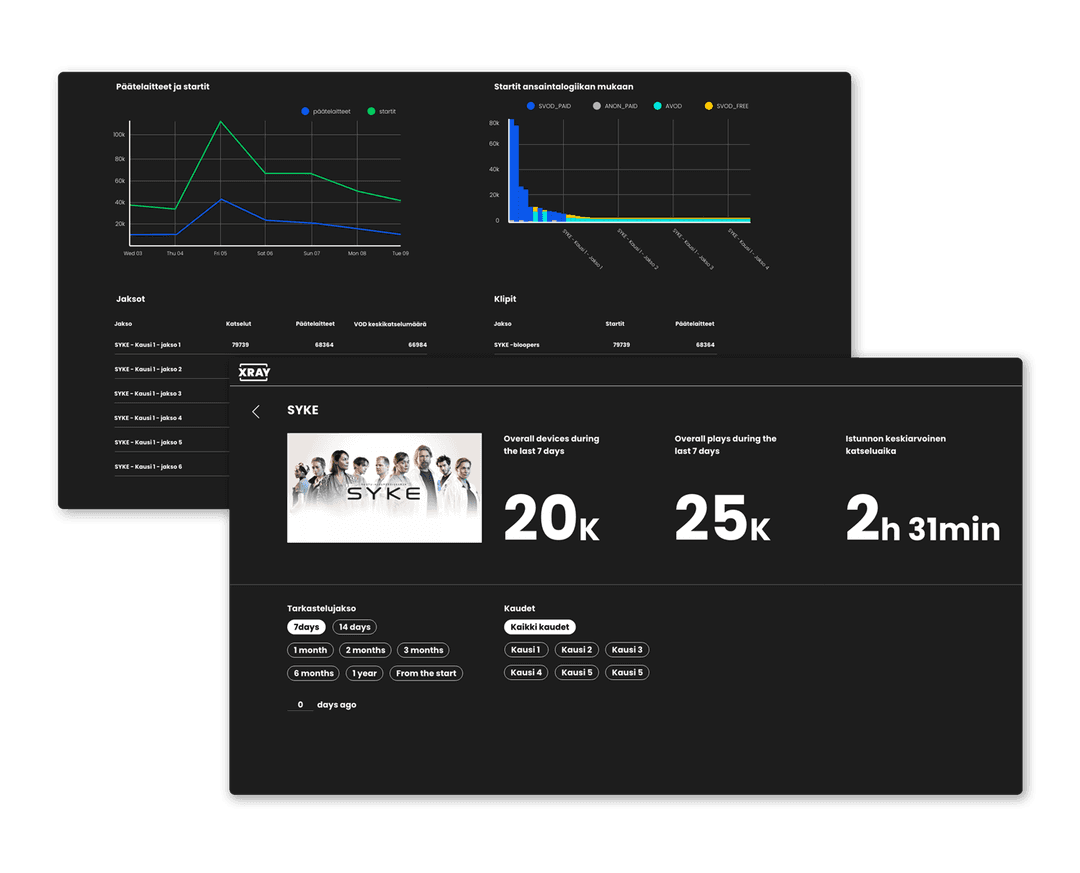
From video analytics proof of concept into partnership

- Video analytics
- Data Platform
- Strategic partnership
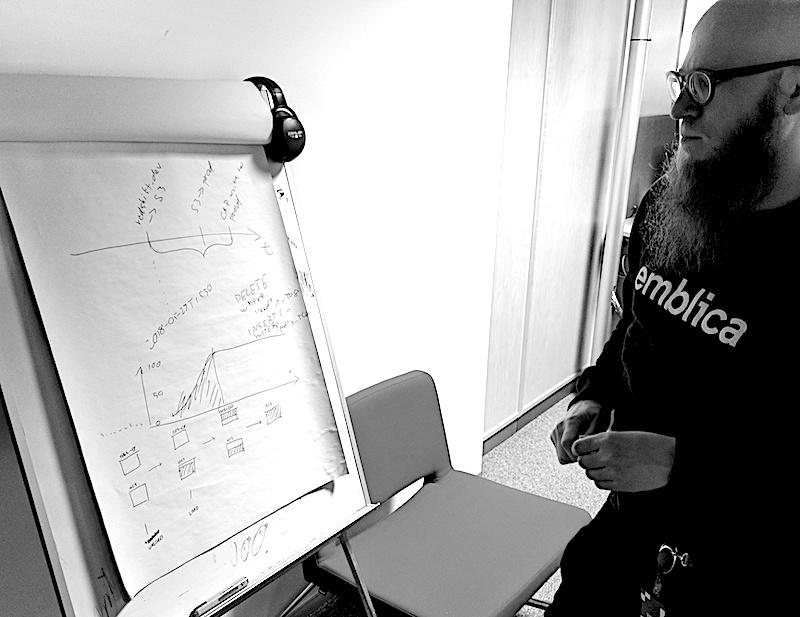
In 2017 Sanoma requested a two week long Proof of Concept for their next video analytics solution.
Our initial collaboration led into a longer association and over time we have executed multiple projects to make Sanoma’s data pipelines better than ever.
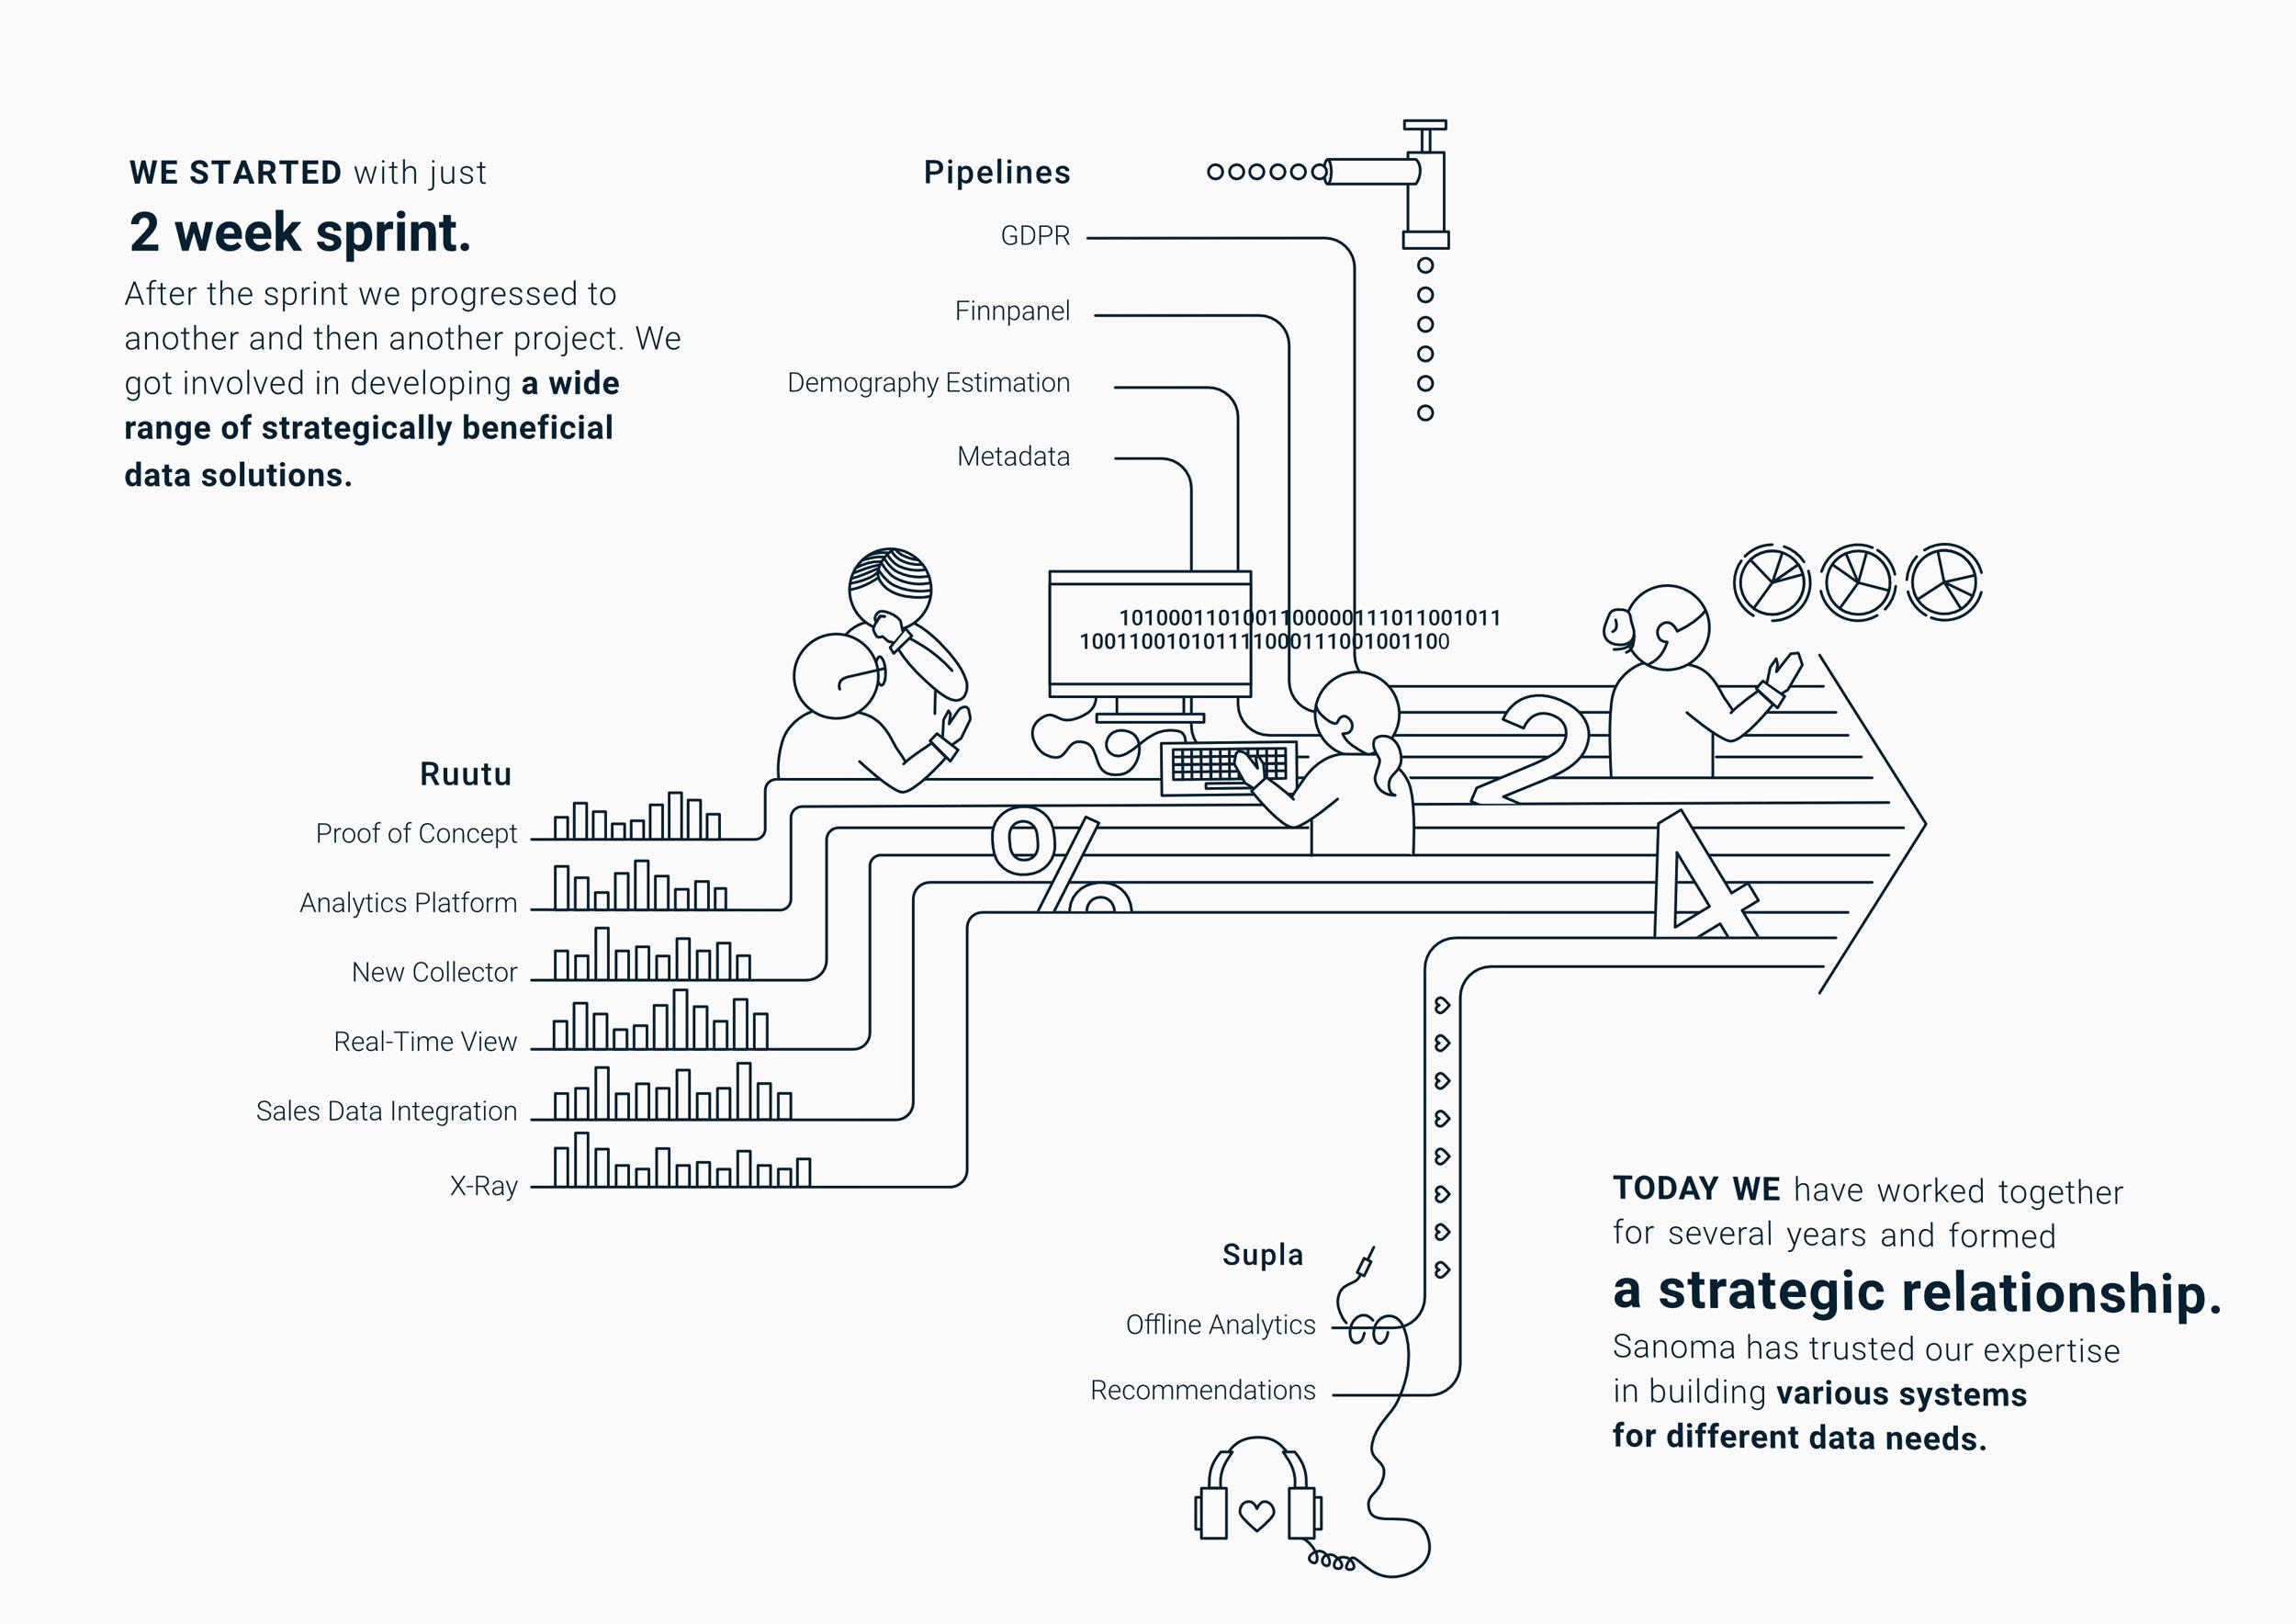
Collaboration with Sanoma and Emblica started when Nelonen was contemplating the next tool to fullfil the analytics needs their online video platform had. The first Proof Of Concept for analytics was built in two weeks, using an existing clickstream data source on top of AWS. The successful trial was followed by almost a year-long pilot, to build the foundations for an entirely new way to process, visualize, and understand analytics and customers in Sanoma.

Delivering a custom analytics platform has its challenges related to scale, data quality & accuracy, old devices, and security. Because of these challenges the enterprises often choose the easy way, and pick an off the shelf solution to solve their analytics challenges. In Sanoma’s case, the decision to develop an in-house solution was backed by their future development roadmap. A tailored tool would better accommodate Sanoma’s data, niche use cases, and existing telemetry implementations in legacy apps. After the initial deployment of the solution, the whole team began to realize the potential and possibilities of the in-house platform. Today Sanoma’s custom architecture has proven itself able to scale for new ideas and changes, while also meeting the requirements of information security and privacy.

After the data, the most precious piece of Sanoma’s analytics system is its architecture. Instead of a gigantic monolith, the implemented micro-service architecture distributes all parts of the system as separate, well-defined pieces of the pipeline. There are different modules for taking in raw events, and aggregating them as sessions. Another component processes a chunk of events, and produces a single session with metrics. This way of structuring makes development and deployment easier, as we can focus on a certain component without a fear of breaking the whole pipeline. On top of that, multiple pipelines can be run simultaneously using the same source data. And of course, these results can be compared.
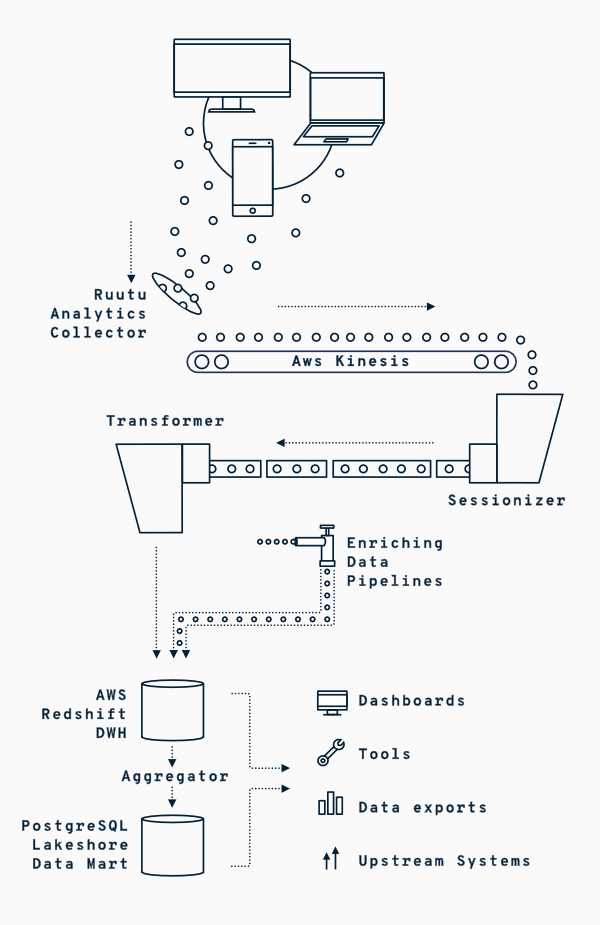
The system is deployed on AWS and each of the data pipeline components is running in containers on Kubernetes. Together with monitoring, telemetry and automation, our system requires minimal amount of attention even in high scale situations and traffic spikes.
All data is stored into an AWS S3-based data lake. Some of that data is indexed into a data warehouse, AWS Redshift, which is the main data storage for analytical queries. Additionally, scheduled aggregates are built and served into dashboards through a lakeshore mart, PostgreSQL.